Enhanced ACWR Plot with Confidence Bands and Reference
Source:R/plot_acwr_enhanced.R
plot_acwr_enhanced.RdCreates a comprehensive ACWR visualization with optional confidence bands and cohort reference percentiles.
Usage
plot_acwr_enhanced(
  acwr_data,
  reference_data = NULL,
  show_ci = TRUE,
  show_reference = TRUE,
  reference_bands = c("p25_p75", "p05_p95", "p50"),
  highlight_zones = TRUE,
  title = NULL,
  subtitle = NULL,
  method_label = NULL
)
Arguments
- acwr_data
A data frame from
calculate_acwr_ewma()containing ACWR values.- reference_data
Optional. A data frame from
calculate_cohort_reference()for adding cohort reference bands.- show_ci
Logical. Whether to show confidence bands (if available in data). Default TRUE.
- show_reference
Logical. Whether to show cohort reference bands (if provided). Default TRUE.
- reference_bands
Which reference bands to show. Default c("p25_p75", "p05_p95", "p50").
- highlight_zones
Logical. Whether to highlight ACWR risk zones. Default TRUE.
- title
Plot title. Default NULL (auto-generated).
- subtitle
Plot subtitle. Default NULL (auto-generated).
- method_label
Optional label for the method used (e.g., "RA", "EWMA"). Default NULL.
Details
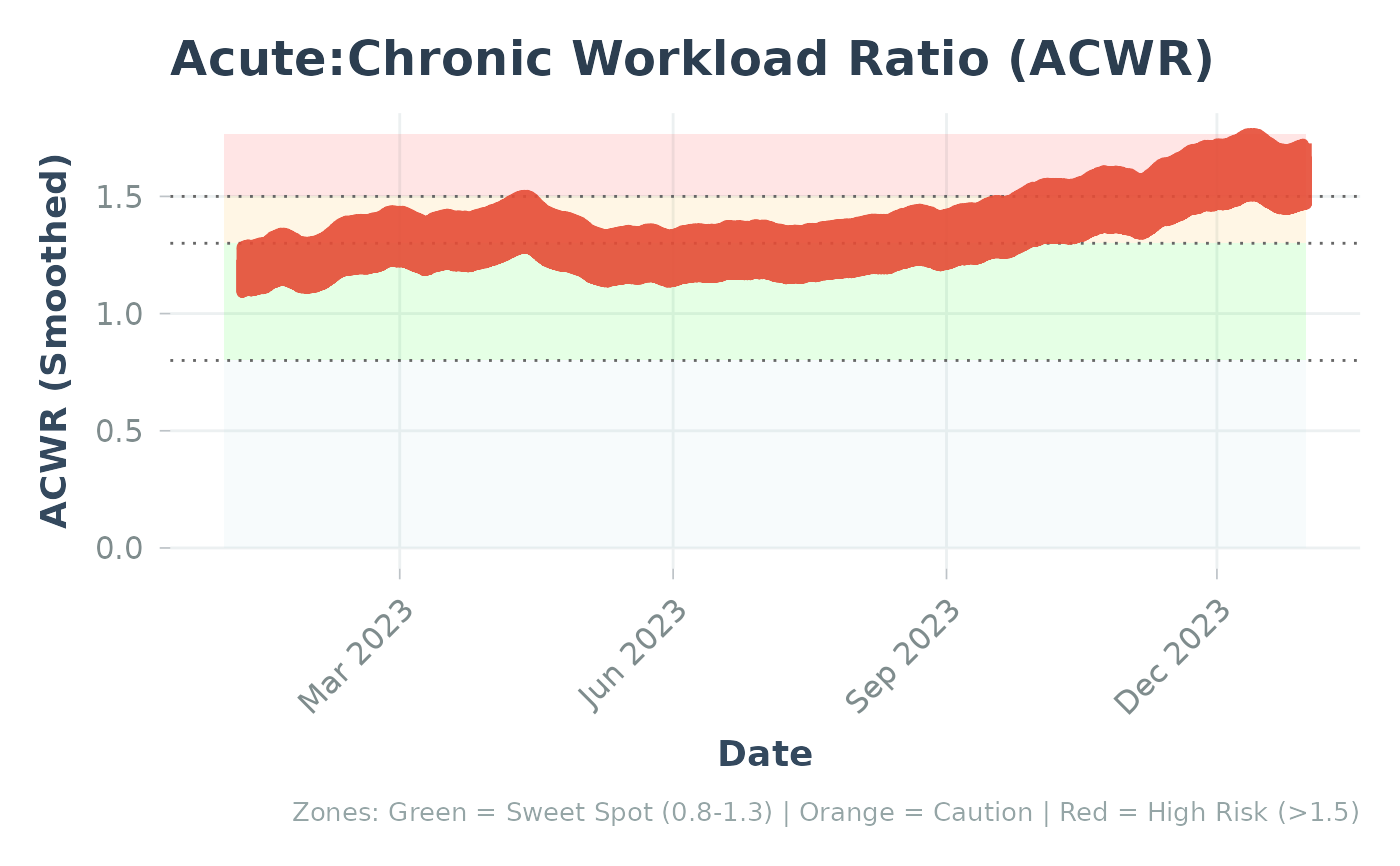
This enhanced plot function combines multiple visualization layers:
Risk zone shading (sweet spot: 0.8-1.3, caution: 1.3-1.5, high risk: >1.5)
Cohort reference percentile bands (if provided)
Bootstrap confidence bands (if available in data)
Individual ACWR trend line
The layering order (bottom to top):
Risk zones (background)
Cohort reference bands (P5-P95, then P25-P75)
Confidence intervals (individual uncertainty)
ACWR line (individual trend)
Examples
# Example using sample data
data("sample_acwr", package = "Athlytics")
if (!is.null(sample_acwr) && nrow(sample_acwr) > 0) {
  p <- plot_acwr_enhanced(sample_acwr, show_ci = FALSE)
  print(p)
}
#> No reference data provided. Setting show_reference = FALSE.


if (FALSE) { # \dontrun{
# Load activities
activities <- load_local_activities("export.zip")

# Calculate ACWR with EWMA and confidence bands
acwr <- calculate_acwr_ewma(
  activities,
  method = "ewma",
  ci = TRUE,
  B = 200
)

# Basic enhanced plot
plot_acwr_enhanced(acwr)

# With cohort reference
reference <- calculate_cohort_reference(cohort_data, metric = "acwr_smooth")
plot_acwr_enhanced(acwr, reference_data = reference)
} # }
if (FALSE) { # \dontrun{
# Load activities
activities <- load_local_activities("export.zip")
# Calculate ACWR with EWMA and confidence bands
acwr <- calculate_acwr_ewma(
activities,
method = "ewma",
ci = TRUE,
B = 200
)
# Basic enhanced plot
plot_acwr_enhanced(acwr)
# With cohort reference
reference <- calculate_cohort_reference(cohort_data, metric = "acwr_smooth")
plot_acwr_enhanced(acwr, reference_data = reference)
} # }