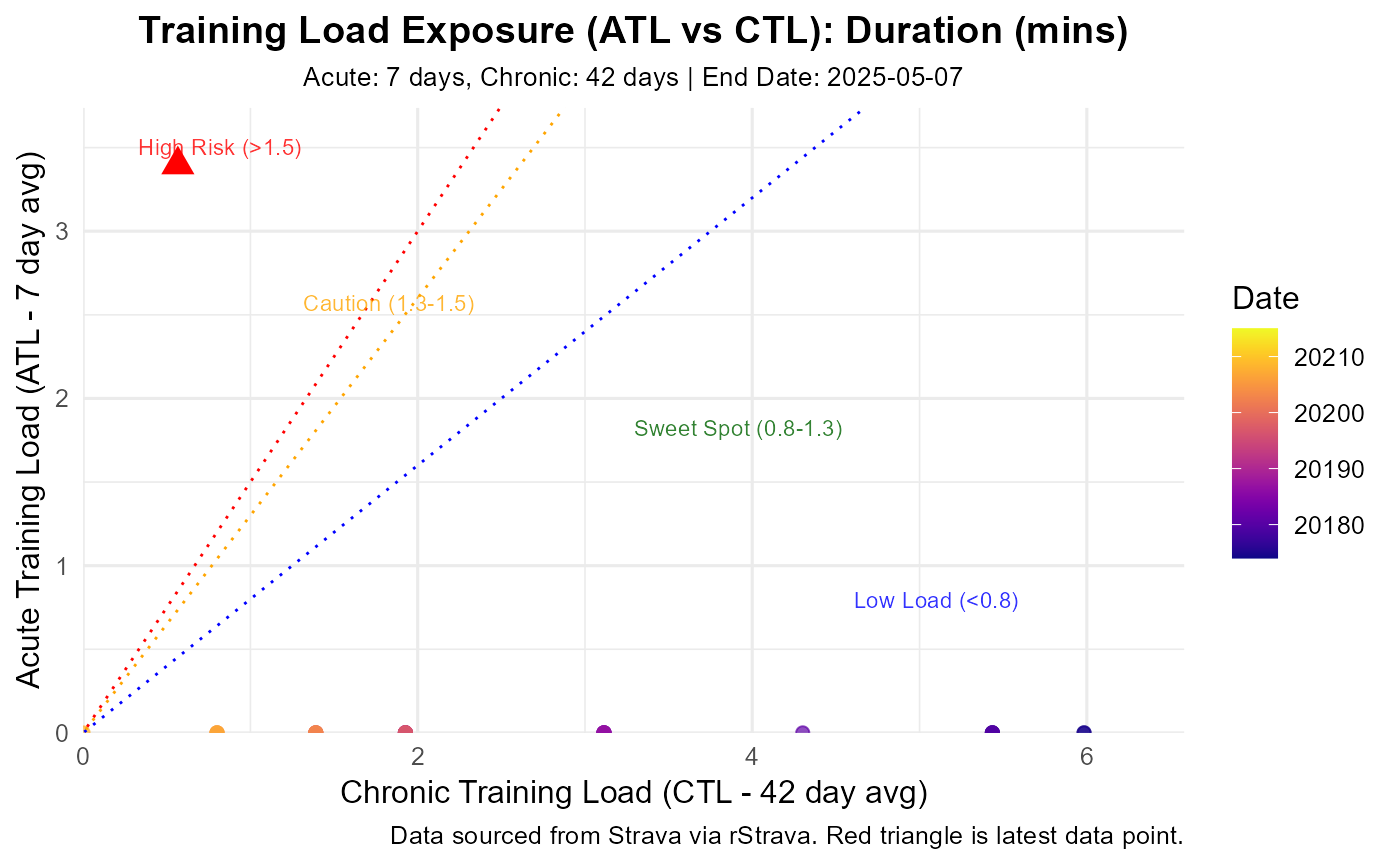
Visualizes the relationship between Acute and Chronic Training Load.
Usage
plot_exposure(
  data,
  activity_type = c("Run", "Ride", "VirtualRide", "VirtualRun"),
  load_metric = "duration_mins",
  acute_period = 7,
  chronic_period = 42,
  user_ftp = NULL,
  user_max_hr = NULL,
  user_resting_hr = NULL,
  end_date = NULL,
  risk_zones = TRUE,
  exposure_df = NULL
)
Arguments
- data
A data frame from
load_local_activities(). Required unlessexposure_dfis provided.- activity_type
Type(s) of activities to include (e.g., "Run", "Ride"). Default uses common types.
- load_metric
Method for calculating daily load (e.g., "duration_mins", "tss", "hrss"). Default "duration_mins". See
calculate_exposurefor details on approximate TSS/HRSS calculations.- acute_period
Days for acute load window (e.g., 7).
- chronic_period
Days for chronic load window (e.g., 42). Must be >
acute_period.- user_ftp
Required if
load_metric = "tss". Your FTP.- user_max_hr
Required if
load_metric = "hrss". Your max HR.- user_resting_hr
Required if
load_metric = "hrss". Your resting HR.- end_date
Optional. Analysis end date (YYYY-MM-DD string or Date). Defaults to today.
- risk_zones
Add background shading for typical ACWR risk zones? Default
TRUE.- exposure_df
Optional. A pre-calculated data frame from
calculate_exposure. If provided,dataand other calculation parameters are ignored. Must containdate,atl,ctl(andacwrifrisk_zones = TRUE).
Details
Plots ATL vs CTL, optionally showing risk zones based on ACWR. Uses
pre-calculated data or calls calculate_exposure.
Visualizes training state by plotting ATL vs CTL (related to PMC charts).
Points are colored by date, latest point is highlighted (red triangle).
Optional risk zones (based on ACWR thresholds ~0.8, 1.3, 1.5) can be shaded.
If exposure_df is not provided, it calls calculate_exposure first.
Examples
# Example using simulated data
data(sample_exposure)
# Ensure exposure_df is named and other necessary parameters like activity_type are provided
p <- plot_exposure(exposure_df = sample_exposure, activity_type = "Run")
#> Generating plot...
print(p)
#> Warning: Removed 27 rows containing missing values or values outside the scale range
#> (`geom_point()`).


if (FALSE) { # \dontrun{
# Example using local Strava export data
activities <- load_local_activities("strava_export_data/activities.csv")

# Plot Exposure trend for Runs (last 6 months)
plot_exposure(
  data = activities,
  activity_type = "Run",
  end_date = Sys.Date(),
  user_ftp = 280
) # Example, if load_metric = "tss"

# Plot Exposure trend for Rides
plot_exposure(
  data = activities,
  activity_type = "Ride",
  user_ftp = 280
) # Example, provide if load_metric = "tss"

# Plot Exposure trend for multiple Run types (risk_zones = FALSE for this example)
plot_exposure(
  data = activities,
  activity_type = c("Run", "VirtualRun"),
  risk_zones = FALSE,
  user_ftp = 280
) # Example, provide if load_metric = "tss"
} # }
if (FALSE) { # \dontrun{
# Example using local Strava export data
activities <- load_local_activities("strava_export_data/activities.csv")
# Plot Exposure trend for Runs (last 6 months)
plot_exposure(
data = activities,
activity_type = "Run",
end_date = Sys.Date(),
user_ftp = 280
) # Example, if load_metric = "tss"
# Plot Exposure trend for Rides
plot_exposure(
data = activities,
activity_type = "Ride",
user_ftp = 280
) # Example, provide if load_metric = "tss"
# Plot Exposure trend for multiple Run types (risk_zones = FALSE for this example)
plot_exposure(
data = activities,
activity_type = c("Run", "VirtualRun"),
risk_zones = FALSE,
user_ftp = 280
) # Example, provide if load_metric = "tss"
} # }